Triple-Net (NNN) Leaseback Investing: Lessons from 3 Real Deals

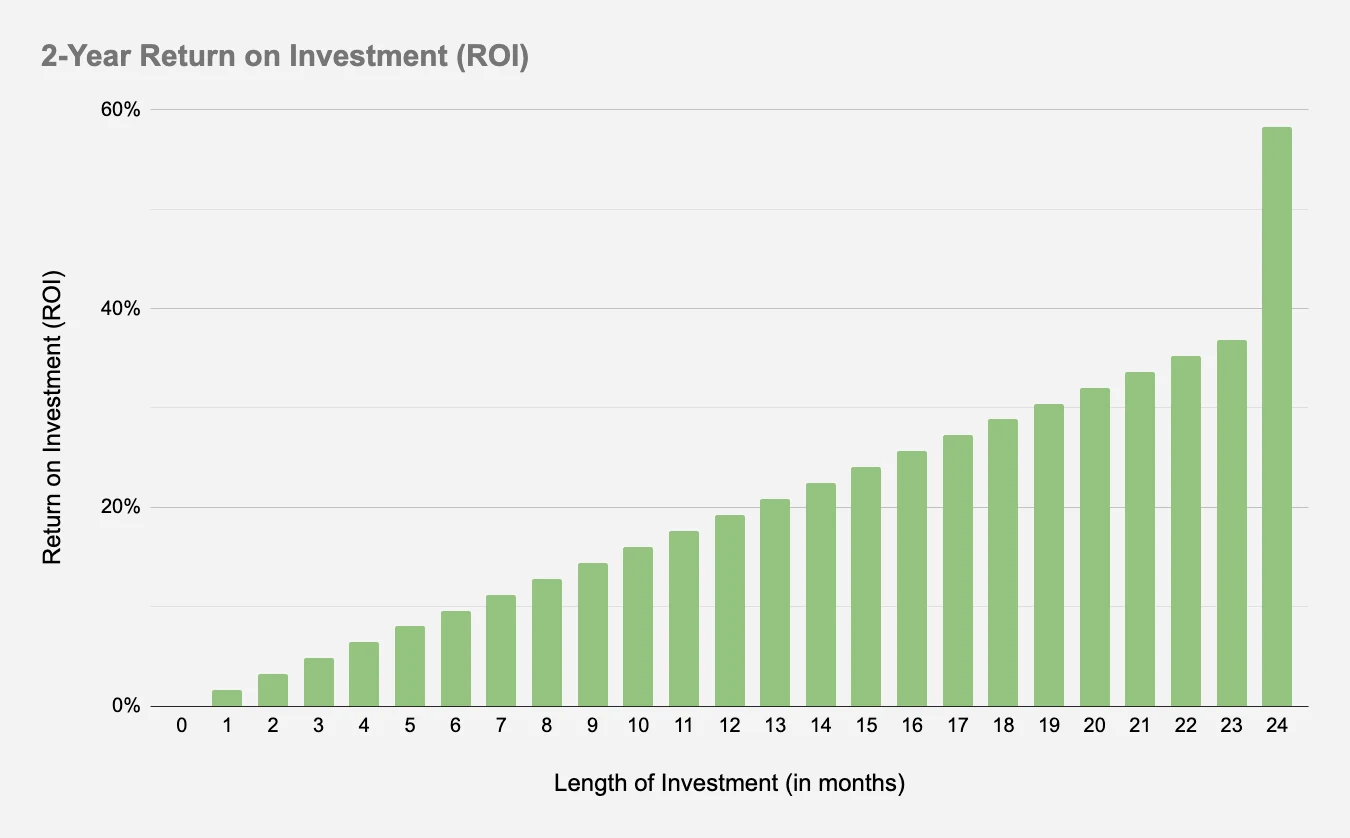
Most real estate investors are familiar with traditional single-family rentals or multifamily syndications, but few have explored the niche world of residential triple-net (NNN) leasebacks. Over several years of active real estate investing, I completed three separate NNN model home leaseback transactions. Each experience delivered radically different outcomes, ranging from a 58% return on investment (ROI) in two years to a painful $58,000 capital loss.
This master guide breaks down how triple-net leasebacks work, analyzes the complete financial performance across all three deals, and highlights the critical risks you must evaluate before entering a leaseback contract.
What Is a Triple-Net (NNN) Leaseback?
A triple-net lease (NNN) is an agreement where the tenant pays the property taxes, building insurance, and routine maintenance in addition to base monthly rent. In residential model home deals, the tenant typically covers HOA dues as well.
A leaseback occurs when the seller of a property leases the asset back from the buyer immediately after closing. The buyer becomes the landlord, and the seller becomes the tenant under terms negotiated during the purchase contract.
In residential real estate, home builders frequently use sale-leasebacks for model homes in master-planned communities. The builder constructs an upgraded showcase home to market new phases, sells the home to an investor to free up construction capital, and leases it back as their sales office for two to three years.
Key Benefits for Home Builders
Capital Liquidity: Liquidates tied-up equity immediately to fund land acquisition or horizontal development elsewhere.
De-risking Market Cycles: Locks in builder margins early without carrying inventory risk during market downturns.
Seamless Operations: Allows uninterrupted use of the showcase property as an operational sales gallery.
Comparison of 3 Real NNN Leaseback Deals
| Metric | Deal 1 (Home Run) | Deal 2 (The Downside) | Deal 3 (The Grind) |
|---|---|---|---|
| Purchase Price | $505,000 | $440,000 | $465,000 |
| Down Payment | $101,000 (20%) | $88,000 (20%) | $116,250 (25%) |
| Interest Rate | 5.000% | 4.875% | 4.750% |
| Leaseback Yield | 9.0% ($45,450/yr) | 9.0% ($39,600/yr) | 8.5% ($39,525/yr) |
| Holding Period | 24 months | 28 months | 23 months |
| Sale Price | $565,000 | $400,000 | $469,900 |
| Net Profit / Loss | +$58,844 | -$18,179 net | +$17,764 |
| Final Total ROI | +58.26% | -20.63% | +15.28% |
Deal 1: The Model Home Run (+58% ROI)
My first foray into triple-net leasebacks was with a regional builder in an expanding suburban corridor. The builder sold me their premier model home for $505,000. Through a regional portfolio lender, I secured a 20% down financing structure ($101,000 initial cash invested) at a 5.0% interest rate.
Under the terms of the agreement:
The builder paid 9% of the purchase price annually in rent ($45,450/year gross).
Annual debt service totaled $26,028 ($2,169 per month).
All taxes, insurance, and HOA dues were paid directly or fully reimbursed by the builder.
Net annual rental cash flow stood at $19,422, producing $38,844 across the 2-year lease term.
At the end of the 24-month lease, local housing demand had surged. I sold the property for $565,000. After standard brokerage commissions and title fees (~7%), net disposition proceeds provided $20,000 in net capital gains. Combined with $38,844 in accumulated rental distributions, the total return was $58,844 on a $101,000 investment: a 58.26% ROI in two years.
Deal 2: When Exit Timing Destroys Returns (-20.6% ROI)
Emboldened by Deal 1, I acquired a second model home from the same builder in a neighboring subdivision for $440,000 with 20% down ($88,000). The leaseback terms matched the first: 9% annual rent ($39,600/year), with full reimbursement for taxes, insurance, and HOA.
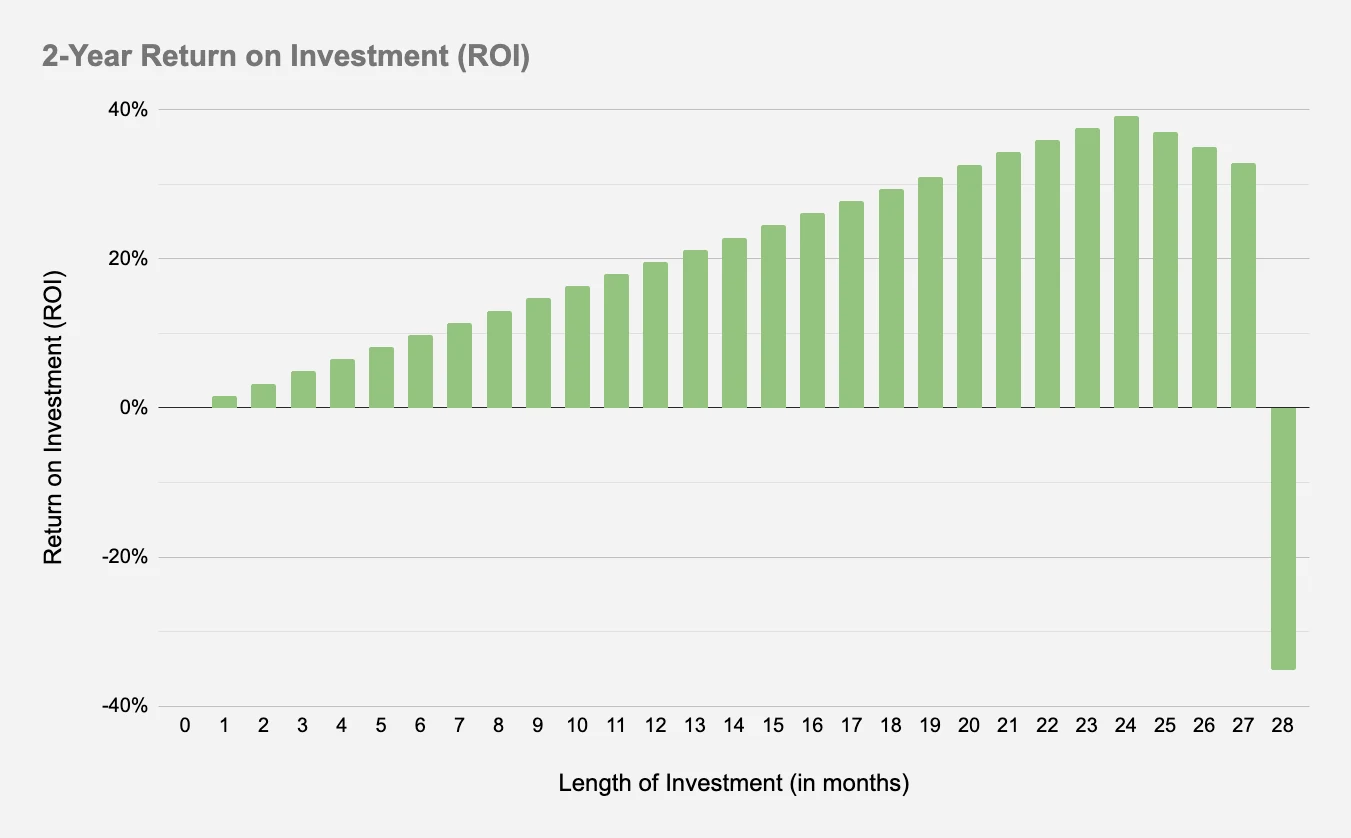
During the two-year operational window, the property performed as promised. The builder paid $79,200 in gross rent against $44,707 in mortgage payments, netting $34,493 in operational cash flow. On paper, the asset delivered a 39.2% operational cash-on-cash yield.
However, short-term leasebacks depend heavily on the disposition price when the lease expires. Unlike long-term rentals, model homes rarely cash flow well as traditional rentals without the inflated builder lease rate.
The Failed Exit Timeline
September 2019: Listed the home at $469,000 three months prior to lease expiration. Received zero showings.
October to November 2019: Cut the price sequentially to $459,000 and then $449,000. Still no offers.
December 2019: The lease ended. I cut the price to $429,900 while carrying vacant holding costs.
February 2020: Slashed list price to $409,000 after five months on market.
April 2020: Finally closed at $400,000 (a $40,000 haircut below purchase price). Sales commissions and closing fees consumed another $18,000, creating a $58,000 gross capital loss.
After factoring in 28 months of holding costs, net operational cash flow dropped to $27,014. Subtracting the $58,000 disposition loss left a net dollar deficit of $30,986 (-35.18% cash loss). After crediting $12,807 in mortgage principal amortization, the final net ROI settled at -20.63%.
Deal 3: Builder Strategy Shift and the 15.3% Grind
For my third transaction, I partnered with a large regional developer on a $465,000 home with 25% down ($116,250). The lease terms provided an 8.5% annual lease rate with standard NNN expense reimbursements.
The first 17 months went smoothly as the builder maintained the premises impeccably. At month 18, the developer altered their master development plan. They elected to sell their remaining undeveloped community parcels to an entry-level builder who planned to construct homes priced in the $300,000s, approximately $100,000 lower than my asset.
This pivot eliminated my neighborhood appraisal comps and capped potential appreciation. The builder offered an early buyout consisting of 3.5 months of rent and zero-commission MLS marketing. I declined the buyout, hired an independent local agent, and listed the home for $469,900.
We secured a full-price contract within days and closed at month 23. After standard 6% commissions and loan payoff, net proceeds yielded a total net profit of $17,764, representing a 15.28% ROI over 23 months.
Critical Lessons for NNN Leaseback Investors
Exit Valuations Make or Break the Deal: Because model home leasebacks are typically 24 to 36 months long, transaction fees (5% to 7% on resale) require roughly 3% annualized asset appreciation just to break even on the disposition.
Builder Creditworthiness Is Your Real Collateral: In an economic downturn, a struggling builder can abandon leaseback obligations or go bankrupt, leaving you with an overpriced asset in an unfinished subdivision.
Subdivision Phase Risk: If the builder discounts remaining inventory or sells off later phases to budget builders, your home's appraisal ceiling will be suppressed.
Model Home Wear and Tear: While sales staff treat model homes better than ordinary tenants, commercial foot traffic and converted garage sales offices require restoration escrow clauses in the initial purchase contract.
Frequently Asked Questions
What is a model home leaseback?
A model home leaseback is an arrangement where a residential builder sells their decorated showcase home to an investor and leases it back for 2 to 3 years to use as an onsite sales office.
Why do builders sell and lease back model homes?
Builders sell model homes to pull invested equity out of completed construction, reduce inventory liabilities on their balance sheets, and fund ongoing building phases without paying commercial carrying costs.
Are NNN residential leasebacks good investments?
They can provide high passive cash yields during the lease term, but short holding periods expose investors to resale market timing risk and high broker commissions upon exit.
Explore more real estate case studies and investment frameworks on Buck by Buck, including our guide on 9 ways to get started with real estate investing and our analysis of why turning a primary residence into a rental can backfire.
Scan to Open on Phone
Point your phone's camera at the QR code to seamlessly continue reading or calculate with your current inputs on mobile.
 Buck by Buck
No app required
Bookmark this page
Press ⌘+D or Ctrl+D to save to your browser bookmarks.
Trending & Popular Guides
How to Set Up a Mega Backdoor Roth With Fidelity
How to Set Up a Backdoor Roth IRA With Fidelity
How to Set Up Automatic Investing with Fidelity
How to Set Up Automatic Investing with E*TRADE
Related Articles & Guides
View all guides
Comparing Cash vs Leveraged Real Estate Investing
Does all-cash really beat leverage? Analyze a side-by-side comparison of annual cash flow, tax benefits, and ROI to determine which strategy fits your current financial goals.
Why I Decided to Invest in Out-of-State Real Estate
I live in San Jose, right in the heart of Silicon Valley, where median home prices exceed $1 million. Yes, $1 million. As a real estate investor, my primary focus is on cash flow.

Ways to Evaluate Rental Properties
There are many factors to consider when evaluating a prospective rental property. While it largely comes down to a numbers game, there are other factors that are important that mat
Discussion 0
Questions, thoughts, or experience to share on Triple-Net (NNN) Leaseback Investing: Lessons from 3 Real Deals? Join the conversation below.